Contact us by phone
- (Board)
- 0568-72-7221
- (Sales)
- 0568-72-7231


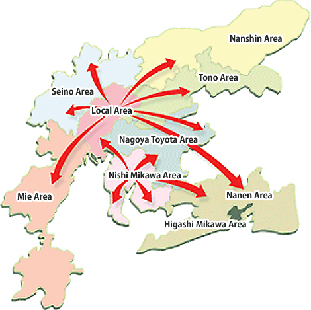
Shipment data of synthetic resin and synthetic rubber from 3 centers in the Komaki region.
The data of individual shippers was divided into 9 areas (Local, Nagoya/Toyota, Nishi-Mikawa, Higashi-Mikawa, Nanen, Mie, Tohno, Seino, and Nansin) and delivery vehicle simulation was carried out.
| Item | Stand-alone distribution | Shared distribution |
|---|---|---|
| Total number of truck journeys | 288 units | 135 units |
| Total weight | 620,508 kg | 620,508 kg |
| Shippers | 81 companies | 81 companies |
| Receivers | 655 companies | 655 companies |
| Average loading rate *1 | 57.6% | 72.9% |
| Average loading rate *2 | 2,155 kg | 4,596 kg |
| Delivery load per receiver | 947 kg | 947 kg |
*1 Total load divided by total maximum payload of all trucks
*2 Total load divided by total number of truck journeys
【Result】
Vehicle use reduced by 55%. Vehicle size increased from 2 t to 4 t and 7 t.
| Model | Stand-alone distribution | Shared distribution |
|---|---|---|
| 10 t | 75.7% | 69.3% |
| 7 t | 76.2% | 76.9% |
| 4 t | 77.2% | 80.4% |
| 2 t | 27.3% | 32.6% |
| Overall | 57.6% | 72.9% |
【Result】
Load efficiency improved by 15%.
| Classification | Stand-alone distribution | Shared distribution |
|---|---|---|
| Mileage (km) | 39,500 | 20,153 |
| Light oil consumption (L) | 9,565 | 5,800 |
| CO2 emission (t) | 24.7 | 15.0 |
【Result】
Distance travelled reduced by 49%.
Light oil consumption reduced by 40%
Annual CO2 emissions cut by 2,600 tons
(9.7 t * 270 days = 2,619 t)